formR documentation
chain simple forms into longer runs, use the power of R to generate pretty feedback and complex designs
Most documentation is inside formr – you can just get going and it will be waiting for you where you need it.
If something just doesn't make sense or if you run into errors, please let us know.
Contents
Getting Started
Creating Studies
To begin creating studies using formr, you need to sign-up with your email and obtain an administrator account. An administrator account is obtained by sending a request via email to accounts@formr.org. Studies in formr are created using spreadsheets. As a good starting point, you can clone the following Google spreadsheet and study it to get versed with the definitions of the item types formr supports.
1. Upload the items:
With your spreadsheet ready, login to formr admin and go to Surveys > Create new Surveys.
You can either upload your spreadsheet if it was stored locally on your computer using the form Upload an item table or
you could import a Google spreadsheet by enabling link sharing and using the form Import a Googlesheet. When importing a Googlesheet,
you will need to manually specify the name of your survey whereas if uploading a spreadsheet, the name of your survey is obtained from the filename
of the spreadsheet.
2. Manage your survey:
If your spreadsheet was well formed (as described here) and the items were successfully uploaded, your survey will be added
to the Surveys menu. To manage your created survey, go to Surveys > YourSurveyName.
In the survey admin area you can test your survey, change survey settings, view and download results, upload and delete survey items etc.
The survey menu to the left in the survey admin area contains hints that you can trigger by hovering over the link.
3.Create a Run/Study: A formr "run" contains your study's complete design. All the things that a single participant is going to do in your study should take place in one run. Designs can range from the simple (a single survey or a randomized experiment) to the complex (like a diary study with daily reminders by email and text message or a longitudinal study tracking social network changes). If you want to go beyond simply surveys, we recommended you read more about runs before you begin. To create a run go to Runs > Create a new Run. Enter a meaningful run name which should contain only of alphanumeric characters and the dash. The name will be shown in the URL of the study, so unlike survey names your participants will see it. If the name was valid and not taken, the run will be added to the Runs menu and you will be redirected to the run admin area. Here you can add Run Units, design the complexity of your study and test your study. To modify your study definition later, you can go to Runs > YourRunName. Your run is the entry point of your study. By default, it is accessible only to you and test users, that you can create. For participants to access your study, you need to set your run as public in the admin area and it will be accessible under the URL https://yourrunname.formr.org
Setting up your own formr instance
If you wish to set up your own instance of formr please follow the guidelines in our installation guide.
There is always help if you need assistance.
formr Runs
A formr "run" contains your study's complete design. All the things that a single participant is going to do in your study should take place in one run. Designs can range from the simple (a single survey or a randomised experiment) to the complex (like a diary study with daily reminders by email and text message or a longitudinal study tracking social network changes).
Inside a run, participants' data is connected, so you can track how many times a participant filled out her diary or whether her social network grew in size since the first measurement time point.
So, why "run"? In formr, runs consist of simple modules that are chained together linearly. Because most modules are boombox-themed, it may help to think of a tape running. Using controls such as the skip backward button, the pause button and the stop button, you control the participant's progression along the run. Surveys can be thought of as the record button: whenever you place a survey in your run, the participant can input data.
Data for the control units are supplied on-the-fly to the statistics programming language R. Therefore, you can dynamically generate feedback graphics for your participants with minimal programming knowledge. With more programming knowledge, nothing keeps you from making full use of R. You could for example conduct complex sentiment analyses on participants' tweets and invite them to follow-up surveys only if they express anger.
Since runs contain your study's complete design, it makes sense that runs' administration side is where every user management-related action takes place. There is a user overview, where you can see at which position in the run each participant is and when they were last active. Here, you can send people custom reminders (if they are running late), shove them to a different position in the run (if they get lost somewhere due to an unforeseen complication) or see what the study looks like for them (if they report problems).
Runs are also where you customise your study's look, upload files (such as images, videos, Javascript files), control access and enrollment. In addition, there are logs of every email sent, every position a participant has visited and of automatic progressions.
Module explanations
Surveys are series of questions (or other items) that are created using simple spreadsheets/item tables (e.g. Excel).
Survey item tables are just spreadsheets and they can just as easily be shared, reused, recycled and collaboratively edited using e.g. Google Sheets.
Surveys can remain fairly simple: a bunch of items that belong together and that a participant can respond to in one sitting. For some people, simple surveys are all they need, but in formr a survey always has to be part of a (simple) run/study.
Surveys can feature various items, allowing e.g. numeric, textual input, agreement on a Likert scale, geolocation and so on.
Items can be optionally shown depending on the participant's responses in the same survey, in previous surveys and entirely different data sources (e.g. data gleaned from Facebook activity). Item labels and choice labels can also be customised using knitr, so you can e.g. refer to a participant's pet or last holiday location by name or use people's preferred term of address.
If you use R, formr includes a few nice timesavers in its R package on Github. Data import can be automated without any funny format business. Items will be correctly typed according to the item table, not according to flawed heuristics. You will also have item and value labels available in R.
If you name your items according to the schema BFI_extra_2R, items with an R at the end can be automatically reversed and items ending on consecutive numbers with the same prefix will be aggregated to a mean score (with the name of the prefix). Using our R package codebook you can then document the data, as well as automatically generate internal consistency analyses and item frequency plots. Hence, some tedious manual data wrangling can be avoided, especially if you start giving your items meaningful and memorable names early on. The formr:: functions are also always available, whenever you use R inside formr runs and surveys.
These are external links - use them to send participants to other, specialised data collection modules, such as a social network generator, a reaction time task, another survey software (we won't be too sad), anything really. However, you can also simply call upon external functionality without sending the participant anywhere – one popular application of this is sending text messages via an R API call.
If you insert the placeholder {{login_code}}, it will be replaced by the participant's run session code, allowing you to link data later (but only if your external module picks this variable up!).
Sometimes, you may find yourself wanting to do more complicated stuff like (a) sending along more data, the participant's age or sex for example, (b) calling an API to do some operations before the participant is sent off (e.g. making sure the other end is ready to receive, this is useful if you plan to integrate formr tightly with some other software) (c) redirecting the participant to a large number of custom links (e.g. you want to redirect participants to the profile of the person who last commented on their Facebook wall to assess closeness) (d) you want to optionally redirect participants back to the run (e.g. as a fallback or to do complicated stuff in formr).
You can either choose to "finish/wrap up" this component before the participant is redirected (the simple way) or enable your external module to call our API to close it only once the external component is finished (the proper way). If you do the latter, the participant will always be redirected to the external page until that page makes the call that the required input has been made.
Using an SMTP account (most email addresses come with one) that you can set up in the mail section, you can send emails to your participants, their friends or yourself. Using the tag {{login_link}}, you can send participants a personalised link to the run. You can also use {{login_code}} to use the session code to create custom links, e.g. for inviting peers to rate this person (informants). Many ISPs limit using their SMTP server to send automated email. Gmail users cannot send more than 500 emails a day and have to disable some advanced security features. Vendors like Sendgrid offer free student accounts as part of the Github education pack and are more amenable to automated emails via SMTP.
Example 1: email to participants or their friend
A simple one-shot survey with feedback. Let's say your run contains
-
Pos. 10. a survey called big5 which assesses the big 5 personality traits and asks for the participant's email address (the field is called
email_address). -
Pos. 20. an email with a feedback plot of the participant's big 5 scores. The recipient field contains
big5$email_address. - Pos. 30. Displays the same feedback as in the email to the participants.
What would happen?
A participant fills out your survey. After completing it, they see the feedback page, which contains a bar chart of their individual big 5 scores. Before they see the page marked by the stop point, an email containing the same feedback is sent off to their email address - this way they get a take-home copy as well.
Example 2: email to yourself
A simple one-shot survey after which you receive a notification.
- Pos. 10. a survey called big5 as above.
-
Pos. 20. an email containing the participant's code. The recipient field contains
'youremailaddress@example.org'. Note the single quotes, they mean that this is a constant. - Pos. 30. Display a thank you note.
What would happen?
A participant fills out your survey. After completing it, they see the thank you note at pos. 30. Before they see the page marked by the stop point, an email is sent off to youremailaddress@example.org - this way you (or whoever's email address you use here) would get an email notification for every participant. This might be helpful in longitudinal surveys where experimenter intervention is required to e.g. set up a phone interview, in an assessment context when you want the scores to be automatically generated, or in a clinical study where you want to do a structured interview after a screening task.
See the Knitr & Markdown section to find out how to generate personalised emails, which contain feedback, including plots. In the next section, you'll learn how to use the email module for invitations in a diary study.
Skip backward allows you to jump back in the run, if a specific condition is fulfilled.
This way, you can create a loop. Loops, especially in combination with reminder emails are useful for diary, training, and experience sampling studies.
The condition is specified in R and all necessary survey data is automatically available. The simplest condition would be TRUE – always skip back, no matter what. A slightly more complex one is nrow(diary) < 14, this means that the diary must have been filled out at least fourteen times. Even more complex: nrow(diary) < 14 | !time_passed(days = 20, time = first(diary$created)), this means that at least 20 days must have passed since the first diary was done and that at least 14 diaries must have been filled out. But any complexity is possible, as shown in Example 2.
Example 1:
A simple diary. Let's say your run contains
- Pos. 10. a survey in which you find out the participant's email address
- Pos. 20. a pause which always waits until 6PM on the next day
- Pos. 30. an email invitation
- Pos. 40. a survey called diary containing your diary questions
-
Pos. 50. You would now add a Skip Backward with the following condition:
nrow(diary) < 14and the instructions to jump back to position 20, the pause, if that is true. - Pos. 60. At this position you could then use a Stop point, marking the end of your diary study.
What would happen?
Starting at 20, participants would receive their first invitation to the diary at 6PM the next day after enrolling. After completion, the Skip Backward would send them back to the pause, where you could thank them for completing today's diary and instruct them to close their web browser. Automatically, once it is 6PM the next day, they would receive another invitation, complete another diary etc. Once this cycle repeated 14 times, the condition would no longer be true and they would progress to position 60, where they might receive feedback on their mood fluctuation in the diary.
Example 2:
But you can also make a loop that doesn't involve user action, to periodically check for external events:
- Pos. 10. a short survey called location that mostly just asks for the participants' GPS coordinates and contact info
- Pos. 20. a pause which always waits one day
- Pos. 30. A Skip Backward checks which checks the weather at the participant's GPS coordinates. If no thunderstorm occurred there, it jumps back to the pause at position 20. If a storm occurred, however, it progresses.
- Pos. 40. an email invitation
- Pos. 50. a survey called storm_mood containing your questions regarding the participant's experience of the storm.
- Pos. 60. A stop button, ending the study.
What would happen?
In this scenario, the participant takes part in the short survey first. We obtain the geolocation, which can be used to retrieve the local weather using API calls to weather information services in the Skip Backward at position 30. The weather gets checked once each day (pause at 20) and if there ever is a thunderstorm in the area, the participant is invited via email (40) to take a survey (50) detailing their experience of the thunderstorm. This way, the participants only get invited when necessary, we don't have to ask them to report weather events on a daily basis and risk driving them away.
This simple component allows you to delay the continuation of the run, be it
until a certain date (01.01.2014 for research on new year's hangovers),
time of day (asking participants to sum up their day in their diary after 7PM)
or to wait relative to a date that a participant specified (such as her graduation date or the last time he cut his nails).
- Pos. 10. a survey collecting personality and contact info + the graduation data of university students
- Pos. 20. a pause which waits until 4 months after graduation
- Pos. 30. an email invitation
- Pos. 40. another personality survey
- Pos. 50. A stop button, ending the study. On this last page, the students get feedback on how their personality has changed after graduation.
See the Knitr & Markdown section to find out how to personalise the text shown while waiting.
Skip forward allows you to jump forward in the run, if a specific condition is fulfilled.
This way, you can create filters, and parallel paths or branches in a study. Filters are useful to screen participants. You may need parallel paths in a study to randomise people to one experimental branch out of many, or to make sure a certain part of your study is only completed by those for whom it is relevant.
Example 1: a filter/screening
Let's say your run contains
- Pos. 10. a survey (depression) which has an item about suicidality
-
Pos. 20. a Skip Forward which checks
depression$suicidal != 1. If the person is not suicidal, it skips forward to pos 40. - Pos. 30. At this position you would use a Stop point. Here you could give the participant the numbers for suicide hotlines and tell them they're not eligible to participate.
- Pos. 40. Here you could do your real survey.
- Pos. 50. A stop button, ending the study.
What would happen?
Starting at 10, participants would complete a survey on depression. If they indicated suicidal tendencies, they would receive the numbers for suicide hotlines at which point the run would end for them. If they did not indicate suicidal tendencies, they would be eligible to participate in the main survey.
Example 2: different paths
Let's say your run contains
- Pos. 10. a survey on optimism (optimism)
- Pos. 20. a Skip Forward which checks
optimism$pessimist == 1. If the person is a pessimist, it skips forward to pos 5. - Pos. 30. a survey tailored to optimists
- Pos. 40. a Skip Forward which checks
TRUE, so it always skips forward to pos 6. - Pos. 50. a survey tailored to pessimists
- Pos. 60. At this position you would thank both optimists and pessimists for their participation.
What would happen?
Starting at 10, participants would complete a survey on optimism. If they indicated that they are pessimists, they fill out a different survey than if they are optimists. Both groups receive the same feedback at the end. It is important to note that we have to let the optimists jump over the survey tailored to pessimists at position 40, so that they do not have to take both surveys.
Waiting Time are like Pauses, but instead of making the participant wait, we wait for the participant.
By waiting for the participant for a certain amount of time, we can make sure that people are reminded to participate in our diary study after one hour—but only if they need a reminder. We can also make sure that a part of a study is only accessible at certain times of day.
Example 1: reminder
Let's say your run contains
- Pos. 10. a pause (e.g. let's say we know when exchange students will arrive in their host country, and they cannot answer questions before they've been there one week)
- Pos. 20. Now we have to send our exchange students an email to invite them to do the survey.
- Pos. 30. a Waiting Time for 7 days. If the user clicks the link to answer questions, the study jumps to position 50, the survey. If two weeks go by without a reaction, the study moves on to the next position, the reminder.
- Pos. 40. This is our email reminder for the students who did not react after 7 days.
- Pos. 50. the survey we want the exchange students to fill out. We set an access window of 7 weeks for this survey (in the survey settings), so we wait at most 7 weeks for students to fill the survey out.
- Pos. 60. Because this is a longitudinal study, we now wait for our exchange students to return home. The rest is left out.
What would happen?
The pause would simply lead to all exchange students being invited once they've been in their host country for a week (we left out the part where we obtained or entered the necessary information). After the invitation, however, we don't just give up, if they don't react. After another week has passed (one week in the host country), we remind them.
How is this done? We set a waiting time for the participant of 7 days.
Now if he doesn't answer for one week, the run will automatically go on to 40, to our email reminder (tentatively titled "Oh lover boy..."). We hope the participant clicks on the link in our invitation email before then though.
If he does, he will jump to the survey at position 60.
If he still doesn't answer, we will patiently wait for another seven weeks. This time, we set an expiry time in the survey settings to achieve this. Until seven weeks have passed he can do the survey. Once the seven weeks are over without him finishing the survey, the run moves on to the next position, which stands for waiting for return home, i.e. we gave up on getting a reaction in the first wave (but we still have "Baby, oh baby, My sweet baby, you're the one" up our sleeve).
You will always need at least one. These are stop points in your run, where you can give short or complex feedback, ranging from "You're not eligible to participate." to "This is the scatter plot of your mood and your alcohol consumption across the last two weeks".
If you combine these end points with Skip Forward, you can have several in your run: You would use the Skip Forward to check whether participants are eligible, and if so, skip over the stop point between the Skip Forward and the survey that they are eligible for. This way, ineligible participants end up in a dead end before the survey. In the edit run interface, you can see green counts of the number of people on this position on the left, so you can see easily how many people are ineligible by checking the count.
See the Knitr & Markdown section to find out how to generate personalised feedback, including plots.
This is a very simple component. You simply choose how many groups you want to randomly assign your participants to. We start counting at one (1), so if you have two groups you will check shuffle$group == 1 and shuffle$group == 2. You can read a person's group using shuffle$group. If you generate random groups at more than one point in a run, you might have to use the last one tail(shuffle$group,1) or check the unit id shuffle$unit_id, but usually you needn't do this.
If you combine a Shuffle with Skip Forward, you could send one group to an entirely different arm/path of the study. But maybe you just want to randomly switch on a specific item in a survey - then you would use a "showif" in the survey item table containing e.g. shuffle$group == 2. The randomisation always has to occur before you try to use the number, but the participants won't notice it unless you tell them somehow (for example by switching on a note telling them which group they've been assigned to).
Survey Spreadsheet
Survey spreadsheets contain the questions on a first sheet called "survey". They can optionally have a second sheet called "choices" where you define choices for multiple choice items in a long format. They can also optionally have a third sheet called "settings" where you define settings such as pagination and validation (most set these settings after uploading the survey though).
You can clone a Google spreadsheet to get started or start with an empty spread sheet.
Some helpful tips:
- You may want to make linebreaks in Excel to format your text. In Microsoft Excel on Macs, you need to press Command ⌘+Option ⌥+Enter ↩, on Windows it is ctrl+Enter ↩. We suggest you start working from the provided sample sheet, because it already has the proper formatting and settings. In Google Spreadsheets, the combination is Option ⌥+Enter ↩.
-
Make text bold using
__bold__, make it italic using*italic*.
| type | name | label | optional | showif |
|---|---|---|---|---|
| text | name | Please enter your name | * | |
| number 1,130,1 | age | How old are you? | ||
| mc agreement | emotional_stability1R | I worry a lot. | age >= 18 | |
| mc agreement | emotional_stability2R | I easily get nervous and unsure of myself. | age >= 18 | |
| mc agreement | emotional_stability3 | I am relaxed and not easily stressed. | age >= 18 |
Available columns
You can use more columns than the ones shown above. Unknown column types are simply ignored, so you can use them for other information.
The following column types exist:
- type
- set the item type (see item types tab)
- name
- this is simply the name of the item. You'll use it to refer to the item in your data analysis and when making complex conditions, so adhere to a systematic naming scheme (we recommend scale1, scale2, scale3R for Likert-type items).
- label
- This column is the text that will be shown on the left-hand side of the answer choices (for most items). You can use Markdown formatting here.
- showif
-
If you leave this empty, the item will always be shown. If it contains a condition, such as
sex == 1, it will only be shown if that condition is true. Conditions are written in R and can be arbitrarily complex. You should always test them well. It is also possible to refer to data in other surveys using e.g.other_survey$item_name != 2. If you refer to data on the same page, items will also be shown dynamically using Javascript. - optional
-
Nearly all items are mandatory by default. By using
*in this column, you can turn items optional instead. Using!requires a response to items that are optional by default (check, check_button). - value
-
Sometimes you may want a value to be pre-set when users first fill out a form. This can be especially handy in longitudinal studies, where you want to check that e.g. contact information is still up-to-date or when you want to highlight changes across days. You can, again, use arbitrarily complex R code (e.g.
a_different_survey$item1 + a_different_survey$item2) to pre-set a value, but you can also simply use1to choose the option with the value 1 (remember that choices for mc-family items are saved as numbers, not as the choice labels per default). There is one special word,sticky, which always pre-sets the items value to the most recently chosen value. You also have to keep in mind when pre-setting strings, that they have to be marked up in R, like this"I am text"(preferably do not use single quotes because Excel will mess them up). - class
- choice1 - choice12
- For multiple choice items, you can define the labels of the different choices here. In the database, the corresponding number will be stored (e.g., if choice1 is "honey", then the DB will record "1"). You can define at most 12 choices this way and you have no control over the value stored in the database. To define more than 12 choices or to reuse choice lists, use the choices sheet.
- This column can optionally be added to visually style items. Find the available classes below.
- item_order
- By default (and if you leave this column empty), items in formr are simply displayed in the order they are defined in the spreadsheet. If you assign numbers here, those will define the order instead. If several items share the same number, their order will be randomized when the survey is loaded.
- block_order
- You can use 1-4 letters to define blocks. For consecutively labelled blocks (without gaps), formr will then randomize block-wise (e.g., an entire block of items comes either first or second). If it helps you think about it, you can imagine, the final order of items as being determined by sorting on block_number.item_number.random_number. If that didn't help enough, how about this guide.
Optional classes for visual styling
You might want to tinker with the look of certain form items. To do so you can use a variety of pre-set CSS classes. This is a fancy way of saying that if you make a new column in your survey sheet, call it "class" and add space-separated magic words, stuff will look different.
These are the available styling classes:
- left100, (200, …, 900)
- controls the width of the left-hand column (labels). The default is left300, you have 100 pixel increments to choose from.
- right100, (200, …, 900)
- controls the width of the right-hand column (answers). There is no default here, usually the right-hand column will extend in accordance with the display width.
- right_offset0, (100, …, 900)
- controls the offset (distance) of the right-hand column to the left (not the label column, just the left). This is 300 pixels (+20 extra) by default. Analogously with left_offset100 etc. (defaults to 0).
-
label_align_left
label_align_center
label_align_right - controls the text alignment of the left-hand column (labels), by default it is aligned to the right.
-
answer_align_left
answer_align_center
answer_align_right - controls the text alignment of the right-hand column (answers), by default it is aligned to the left.
- answer_below_label
- This leads to answers stacking below labels, instead of them being side-by-side (the default). It entails zero offsets and left alignment. Can be overridden with offsets and the alignment classes.
- hide_label
- This hides the labels for mc and mc_multiple replies. Useful in combination with a fixed width for mc, mc_multiple labels and mc_heading – this way you can achieve a tabular layout. On small screens labels will automatically be displayed again, because the tabular layout cannot be maintained then.
- show_value_instead_of_label
- This hides the labels for mc_button and mc_multiple_button, instead it shows their values (useful numbers from 1 to x). Useful in combination with mc_heading – this way you can achieve a tabular layout. On small screens labels will automatically be displayed again, because the tabular layout cannot be maintained then.
-
rotate_label45, rotate_label30,
rotate_label90 - This rotates the labels for mc and mc_multiple replies. Useful if some have long words, that would lead to exaggerated widths for one answer column.
- mc_block
- This turns answer labels for mc-family items into blocks, so that lines break before and after the label.
- mc_vertical
- This makes answer labels for mc-family items stack up. Useful if you have so many options, that they jut out of the viewport. If you have very long list, consider using select-type items instead (they come with a search function).
- mc_horizontal
- This makes answer labels for mc-family items stay horizontal on small screens.
- mc_equal_widths
- This makes answer labels for mc-family items have equal widths, even though their contents would lead them to have different widths. This won't work in combination with every other option for mc-styling and if your widest elements are very wide, the choices might jut out of the viewport.
-
mc_width50 (60, … ,
100, 150, 200) - This makes choice labels and choice buttons for mc-family items have fixed widths. If one choice has text wider than that width, it might jut out or ignore the fixed width, depending on the browser.
-
rating_button_label_width50
(60, … , 100, 150, 200) - This makes the labels for rating_button items have fixed widths. This can be useful to align rating_buttons buttons with each other even though the end points are labelled differently. A more flexible solution would be to horizontally center the choices using answer_align_center.
-
space_bottom_10
(10, 20, … , 60) - Controls the space after an item. Default value is 15.
-
space_label_answer_vertical_10
(10, 20, … , 60) - Controls the vertical space between label and choices, if you've set answer_below_label. Default value is 15.
- clickable_map
- If you use this class for a text type item, with one image in the label, this image will become a clickable image, with the four outer corners selectable (the selection will be stored in the text field). Will probably require customisation for your purposes.
Choices Spreadsheet
Choices sheets are fairly simple. The list_name column defines the choice set. By using that name in the type column of a multiple-choice item, you assign that choice set. As you'd expect, the value column defines the value recorded in the database, the label defines what participants see by default. It is not currently possible to randomly order choice sets. You can use Javascript to achieve this.
You can clone a Google spreadsheet to get started.
| list_name | name | label |
|---|---|---|
| agreement | 1 | disagree completely |
| agreement | 2 | rather disagree |
| agreement | 3 | neither agree nor disagree |
| agreement | 4 | rather agree |
| agreement | 5 | agree completely |
Survey Item Types
There are a lot of item types, in the beginning you will probably only need a few though. To see them in action, try using the following Google spreadsheet or fill it out yourself. It contains example uses of nearly every item there is.
Plain display types
- note
- display text. Notes are only displayed once, you can think of them as being "answered" simple by submitting.
- note_iframe
- If you want to render complex rmarkdown htmlwidgets, use this.
- submit timeout
-
display a submit button. No items are displayed after the submit button, until all of the ones preceding it have been answered. This is useful for pagination and to ensure that answers required for
showifor for dynamically generating item text have been given.
You can specify an optional timeout/delay (in milliseconds).
Negative values mean that the user has to wait that long until they can click submit.
Positive values mean the submit button will automatically submit after that time has passed. However, if not all items are answered or optional, the user will end up on the same page and the timer will restart. To avoid that, you have to use it together with optional items. Then, it's a way to use timed submissions. The data in the item display table can be used to check how long an item was displayed and whether this matches with the server's time for when it sent the item and received the response.
Simple input family
- text max_length
-
allows you to enter a text in a single-line input field. Adding a number
text 100defines the maximum number of characters that may be entered. - textarea max_length
- displays a multi-line input field
- number min, max, step
-
for numbers.
stepdefaults to1, usinganywill allow any decimals. - letters max_length
-
like text, allows only letters (
A-Za-züäöß.;,!:), no numbers. - for email addresses. They will be validated for syntax, but they won't be verified unless you say so in the run.
Sliders
- range min,max,step
-
these are sliders. The numeric value chosen is not displayed. Text to be shown to the left and right of the slider can be defined using the choice1 and choice2 fields. Defaults are
1,100,1. - range_ticks min,max,step
- like range but the individual steps are visually indicated using ticks and the chosen number is shown to the right.
Datetime family
- date min,max
-
for dates (displays a date picker). Input can be constrained using the min,max parameters. Allowed values would e.g. be
2013-01-01,2014-01-01or-2years,now. - time min,max
-
for times (displays an input with hours and minutes). Input can also be constrained using min,max, e.g.
12:00,17:00
Fancy family
- geopoint
- displays a button next to a text field. If you press the button (which has the location icon on it) and agree to share your location, the GPS coordinates will be saved. If you deny access or if GPS positioning fails, you can enter a location manually.
- color
- allows you to pick a color, using the operating system color picker (or one polyfilled by Webshims)
Multiple choice family
The, by far, biggest family of items. Please note, that there is some variability in how the answers are stored. You need to know about this, if you (a) intend to analyse the data in a certain way, for example you will want to store numbers for Likert scale choices, but text for timezones and cities (b) if you plan to use conditions in the run or in showif or somewhere else where R is executed. (b) is especially important, because you might not notice if demographics$sex == 'male' never turns true because sex is stored as 0/1 and you're testing as female.
- mc choice_list
- multipe choice (radio buttons), you can choose only one.
- mc_button choice_list
-
like
mcbut instead of the text appearing next to a small button, a big button contains each choice label - mc_multiple choice_list
- multiple multiple choice (check boxes), you can choose several. Choices defined as above.
- mc_multiple_button
- like mc_multiple and mc_button
- check
- a single check box for confirmation of a statement.
- check_button
- a bigger button to check.
-
rating_button
min, max, step -
This shows the choice1 label to the left, the choice2 label to the right and a series of numbered buttons as defined by
min,max,stepin between. Defaults to 1,5,1. - sex
-
shorthand for
mc_buttonwith the ♂, ♀ symbols as choices - select_one choice_list
- a dropdown, you can choose only one
- select_multiple choice_list
- a list in which, you can choose several options
-
select_or_add_one
choice_list, maxType - like select_one, but it allows users to choose an option not given. Uses Select2. maxType can be used to set an upper limit on the length of the user-added option. Defaults to 255.
-
select_or_add_multiple
choice_list, maxType,
maxChoose - like select_multiple and select_or_add_one, allows users to add options not given. maxChoose can be used to place an upper limit on the number of chooseable options.
- mc_heading choice_list
-
This type permits you to show the labels for mc or mc_multiple choices only once.
To get the necessary tabular look, assign a constant width to the choices (using e.g. mc-width100), give the heading the same choices as the mcs, and give the following mcs (or mc_multiples) the same classes + hide_label.
On small screens the mc_heading will be hidden and labels will automatically be displayed again, because the tabular layout would otherwise break down.
Hidden family
These items don't require the user to do anything, so including them simply means that the relevant value will be stored. If you have exclusively hidden items in a form, things will wrap up immediately and move to the next element in the run. This can be useful for hooking up with other software which sends data over the query string i.e. https://formr.org/run_name?param1=10&user_id=29- calculate
- in the value column you can specify an R expression, the result of which will be saved into this variable. Useful to pull in external data or to forestall recalculating something repeatedly that you want to refer to later. If the calculation is based on values from the same module, you can insert the calculate item in the last line of the sheet behind the last submit button and its result will be stored in the database for use in further modules.
- ip
- saves your IP address. You should probably not do this covertly but explicitly announce it.
- referrer
- saves the last outside referrer (if any), ie. from which website you came to formr
- server var
- saves the $_SERVER value with the index given by var. Can be used to store one of 'HTTP_USER_AGENT', 'HTTP_ACCEPT', 'HTTP_ACCEPT_CHARSET', 'HTTP_ACCEPT_ENCODING', 'HTTP_ACCEPT_LANGUAGE', 'HTTP_CONNECTION', 'HTTP_HOST', 'QUERY_STRING', 'REQUEST_TIME', 'REQUEST_TIME_FLOAT'. In English: the browser, some stuff about browser language information, some server stuff, and access time.
- get var
-
saves the
varfrom the query string, so in the example aboveget param1would lead to 10 being stored. - random min,max
- generates a random number for later use (e.g. randomisation in experiments). Minimum and maximum default to 0 and 1 respectively. If you specify them, you have to specify both.
- hidden
- you can use this item with a pre-set value, if you need to use data from previous pages together with data on the same page for a showif
- block
-
Blocks progress. You can give this item a showif such as
(item1 + item2) > 100to add further requirements.
File uploads
You can ask study participants to upload image, audio, video, text, and PDF files in formr. Server-side limits for the maximal file sizes apply, you can also set lower limits per item.- file max_size_in_bytes
- Permits all of the file types allowed by audio, video, image plus PDFs and some text files.
- audio max_size_in_bytes
- Upload audio files. If you assign the class "record_audio" in the class column, a little recording interface will be shown. It will use the device microphone.
- video max_size_in_bytes
- Upload video files.
- image max_size_in_bytes
- Upload image files. On smartphones, this can trigger the camera app.
Knit R & Markdown
This section gives some guidance on how to format and customise text in formr. In many cases you'll do it right by default. You'll also see how to access the data you just collected in formr in R — for example to score an assessment, give feedback, or customise the study in other ways.
Markdown
You can format text/feedback everywhere (i.e. item labels, choice labels, the feedback shown in pauses, stops, in emails) in a natural fashion using Github-flavoured Markdown.
The philosophy is that you write like you would in a plain-text email and Markdown turns it nice.
In most cases, characters with special meaning won't entail unintended side effects if you use them normally, but if you ever need to specify that they shouldn't have side effects, escape it with a backslash: \*10\* doesn't turn italic.
* list item 1
* list item 2
will turn into a nice bulleted list.
- list item 1
- list item 2
# at the beginning of a line turns it into a large headline, ## up to ###### turn it into smaller ones.
*italics* and __bold__ are also easy to do.
[Named links](http://yihui.name/knitr/) and embedded images  are easy. If you simply paste a link, it will be clickable automatically too, even easier. Email addresses are a bit special, you need the "mailto:" prefix: [Contact us](mailto:contact_email@example.com).
You can quote something by placing a > at the beginning of the line.
If you're already familiar with HTML you can also use that instead, though it is a little less readable for humans. Or mix it with Markdown! You may for example use it to go beyond Markdown's features and e.g. add icons to your text using <i class="fa fa-smile-o"></i> to get for instance. Check the full set of available icons at Font Awesome.
Knitr
If you want to customise the text or generate custom feedback, including plots, you can use Knitr. Thanks to Knitr you can freely mix Markdown and chunks of R. You can load data using R commands, but the data you just collected for this participant will automatically be made available as R data frames. See R helpers for more information. Some examples:
-
Today is `r date()`shows today's date.
-
Hello `r demographics$name`greets someone using the variable "name" from the survey "demographics".
-
Dear `r ifelse(demographics$sex == 1, 'Sir', 'Madam')`greets someone differently based on the variable "sex" from the survey "demographics".
-
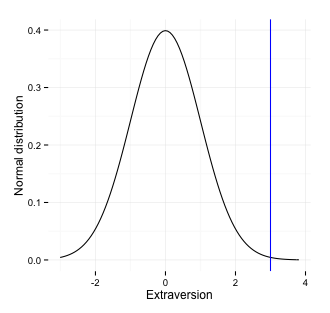
You can also plot someone's extraversion on the standard normal distribution.
```{r}yieldslibrary(formr) # build scales automatically big5 = formr_aggregate(results = big5) # standardise big5$extraversion = scale(big5$extraversion, center = 3.2, scale = 2.1) # plot qplot_on_normal(big$extraversion, xlab = "Extraversion")```
R Helpers
R in formr
In formr, you can use R to write simple and complex code. Various places allow you to specify either R code (e.g., showif column, value column, SkipForward/SkipBackward, External, Pause button conditions) or R code interspersed with Markdown (as in knitr, e.g., labels, Stop button, Pause button texts). The R code you wrote will be automatically enriched with the data objects you name and processed using OpenCPU. By default, your participants cannot view the R code you write.
Automatically enriched data
When you write R code in formr, we try to automatically determine what data you need and supply it. To do so, formr has a look up table of all the available data (the surveys defined in the run, the items defined in these surveys, as well as some metadata about the participant and run progress).
For example, to obtain somebody's age, you need only write demographics$age. formr will then automatically create a data frame named "demographics" containing the variable "age". To give another example, to see whether a participant ever reported a headache in your diary, you might just write any(diary$headache > 1). In this case, formr would create a data frame containing all responses to the headache question. It's important to note that formr simply checks whether the name of the survey exists anywhere in the text and whether the name of the item exists anywhere else. So, demographics$age works, but so does demographics[, 'age']. If an item name exists in multiple surveys that you have named, it will be supplied for all surveys.
Available data
- user_id
- The unique user code which we use for logging people in, e.g., NqbpASFVlcci5cnVvpMZG4ueILaYvFk39fDND305XvPLh3KW4xzrP0ygJ1phs1gf.
- .formr
$login_link $login_code $nr_of_participants $session_last_active - Useful shortcuts to obtain the link to the personalised study link, the login code (currently the same as user_id), the total number of participants in the run (even those who only saw the first page), as well as a date-time when the current participant was last active.
- YourSurvey
$YourItem1
$YourItem2 - Any of the surveys that are part of the run and any of their items can be requested in this way. In addition, if you have named items belonging to a scale with a numeric suffix and an optional R, you need only name the scale (e.g., extraversion) and all items (e.g., extraversion1, extraversion2R, extraversion3) will be supplied.
- survey_users
$created
$modified
$user_code
$email
$email_verified
$mobile_number
$mobile_verified - This data frame contains user account information, such as when the account was created, the user's contact details, and whether they have been verified. This is usually empty, because most study participants don't sign up on formr.
- survey_run_sessions
$session
$created
$last_access
$ended
$position
$current_unit_id
$deactivated
$no_email - This data frame tracks user sessions in the run/study, including when they started the study (created), last accessed it, ended it (reached a Stop button), the current position in the run, and whether the user has opted out of email notifications.
- survey_unit_sessions
$created
$ended
$expired
$unit_id
$position
$type - This data frame contains metadata about the progression of the user through the run/study, including when they reached each unit (created), left it (ended), and so on.
- externals
$created
$ended
$position - Metadata about external units linked to the study, i.e. when users were sent there, whether they returned/completed the external unit (ended) and the position in the run.
- survey_items_display
$created
$answered_time
$answered
$displaycount
$item_id - This data frame tracks the display and response behavior for survey items, including timestamps for when they were displayed and answered.
- survey_email_log
$email_id
$created
$recipient - This data frame logs email interactions, including when an email was sent and its recipient.
- shuffle
$unit_id
$created
$group - This data frame tracks shuffled units and the group they belong to for randomisation purposes.
Packages
Wherever you use R in formr you can also use the functions in its R package. If you want to use the package in a different environment, you'll need to install it using the following code.
install.packages('formr', repos = c('https://rforms.r-universe.dev', 'https://cloud.r-project.org'))The package currently has the following feature sets
- Some shorthand functions for frequently needed operations on the site:
first(cars) # first non-missing value last(cars) # last non-missing value current(cars) # last value, even if missing "formr." %contains% "mr." # will yield TRUE "formr." %contains_word% "mr" # will yield FALSE "12, 15" %contains% "1" # will yield TRUE "12, 15" %contains_word% "1" # will yield FALSE - Some helper functions to make it easier to correctly deal with dates and times:
time_passed(hours = 7) next_day() in_time_window(time1, time2) - Connecting to formr, importing your data, correctly typing all variables, automatically aggregating scales.
- Easily making feedback plots e.g.
The package also has a function to simulate possible data, so you can try to make feedback plots ahead of collecting data.qplot_on_normal(0.8, "Extraversion")
Further data
Sometimes, you need more than the data that formr auto-enriches your study with. For example, you might have designed a couples' diary study and need the partner's data to synchronize participation. In these cases, you will have to explicitly load the data using formr's API.
Other times, you might want to import data from elsewhere on the web. You can R packages and functions to, for example, read a participant's social media posts or to look up information in an external, online database.
Features
The following designs and many more are possible:
- simple surveys with and without feedback
- complex surveys (using skipping logic, personalised text, complex feedback)
- surveys with eligibility limitations
- diary studies including completely flexible automated email/text message reminders
- longitudinal studies (e.g. automatically re-contact participants after they return from their exchange year). The items of later waves need not exist in final form at wave 1.
- longitudinal social networks and other studies that require rating a variable number of things or persons
Core strengths
- generates very pretty feedback live, including ggplot2, and interactive ggvis plots and htmlwidgets. We find that this greatly increases interest and retention in our studies.
- automates complex experience sampling, diary and training studies, including automated reminders via email or text message
- looks nice on a phone (about 30-40% of participants fill out our surveys on a mobile device)
- easily share, swap and combine surveys (they're simply spreadsheets) and runs (you can share complete designs, e.g. "daily diary study")
- you can use R to do basically anything that R can do (i.e. complicated stuff, like using a sentiment analysis of a participant's Twitter feed to decide when the survey happens)
- not jealous at all – feel free to integrate other components (other survey engines, reaction time tasks, whatever you are used to) with formr, we tried our best to make it easy.
Features
- manage access to and eligibility for studies
- longitudinal studies
- send text messages (see the HowTo)
- works on all somewhat modern devices and degrades gracefully where it doesn't
- formats text using Github-flavoured Markdown (a.k.a. the easiest and least bothersome way to mark up text)
- file, image, video, sound uploads for users (as survey items) and admins (to supply study materials)
- complex conditional items
- a dedicated formr R package: makes pretty feedback graphs and complex run logic even simpler. Simplifies data wrangling (importing, aggregating, simulating data from surveys).
- a nice editor, Ace, for editing Markdown & R in runs.
Plans:
- work offline on mobile phones and other devices with intermittent internet access (in the meantime enketo is pretty good and free too, but geared towards humanitarian aid)
- a better API (some basics are there)
- social networks, round robin studies - at the moment they can be implemented, but are a bit bothersome at first. There is a dedicated module already which might also get released as open source if there's time.
- more planned enhancements on Github
formr API
The formr API is the primary way to get data/results out of the platform. It's a low-level HTTP-based API that you can use principally to get results of a study for specified participants (sessions)
Resource requests to the formr API require that you have a valid access token which you can obtain by providing API credentials (a client id and a client secret)
API base URL:
https://api.formr.org
Obtaining Client ID and Client Secret
Access to the API is restricted, so only the administrators of formr are able to provide API credentials to formr users. To obtain API credentials, send an email to Cyril and your credentials will be sent to you.
Obtaining An Access Token
An access token is an opaque string that identifies a formr user and can be used to make API calls without further authentication. formr API access tokens are short-lived and have a life span of about an hour.
To generate an access token you need to make an HTTP POST request to the token endpoint of the API
POST /oauth/access_token?
     client_id={client-id}
    &client_secret={client-secret}
    &grant_type=client_credentials
This call will return a JSON object containing an access token which can be used to access the API without further authentication required.
Sample successful response
{
	"access_token":"XXXXXX3635f0dc13d563504b4d",
	"expires_in":3600,
	"token_type":"Bearer",
	"scope":null
}
The attribute expires_in indicates the number of seconds for which is token is valid from its time of creation. If there is an error for example if the
client details are not correct, then an error object is returned containing an error_description and sometimes an error_uri where you can read more about the
generated error. An example of an error object is
{
	"error":"invalid_client",
	"error_description":"The client credentials are invalid"
}
Making Resource Requests using generated access token
With the generated access token, you are able to make requests to the resource endpoints of the formr API. For now only the results resource endpoint has been implementedGetting study results over the API
REQUEST
To obtain the results of a particular set of sessions in a particular run, send a GET HTTP request to the get endpoint along side the access_token obtained above together with the necessary parameters as shown below:
GET /get/results?
     access_token={access-token}
    &run[name]={name of the run as it appears on formr}
    &run[sessions]={comma separated list of session codes OR leave empty to get all sessions}
    &surveys[survey_name1]={comma separated list items to get from survey_name1 OR leave empty to get all items}
    &surveys[survey_name2]={comma separated list items to get from survey_name2 OR leave empty to get all items}
Notes:
- survey_name1 and survey_name2 should be the actual survey names
- If you want to get results for all surveys in the run you can omit the survey parameter
- If you want to get all items from a survey, keep the items list empty.
RESPONSE
The response to a results request is a JSON object. The keys of this JSON structure are the names of the survey that were indicated in the requested and the value associated to each survey entry is an array of objects representing the results collected for that survey for all the requested sessions. An example of a response object could be the following:
{
	"survey_1": [{
		"session": "sdaswew434df",
		"survey_1_item_1": "answer1",
		"survey_1_item_2": "answer2",
		"survey_1_item_2": "answer3",
	},
	{
		"session": "fdgdfg4323",
		"survey_1_item_1": "answer4",
		"survey_1_item_2": "answer5",
		"survey_1_item_2": "answer6",
	}],
	"survey_2": [........]
}
Using the formr API in R
# load the httr package
library(httr)

# Login using your client ID and client Secret to get an access token
login <- list( # define login credentials
  client_id = "bb472xxxxxxxxe1918",
  client_secret = "zEfgeyJ0eXXXXXEwYwNGZj",
  grant_type = "client_credentials"
)
request <- POST( # send POST request
  "https://api.formr.org/oauth/access_token",
  body = login,
  encode = "form"
)
# parse response to get access token
# If there an error then the response object would contain the details of the error in response$error
response <- content(request)
access_token <- response$access_token

#With a valid access token, call API to get the results of a particular study (run)
query <- list(
  access_token = access_token,
  "run[name]" = "/enter run name here/",
  "run[session]" = "/here you can specify a full session code or just a substring(but include the beginning /",
  "surveys[survey_1]" = "item_1, item_2, item_etc.", # comma separated list of items to get from the survey or leave empty string to get all items
  "surveys[survey_2]" = "item_3, item_4, item_etc."
)
request <- GET("https://api.formr.org/get/results", query=query)
results <- content(request)

# With a valid response you can, for example, extract the results of a particular survey say 'survey_1':
survey_1 = results$survey_1
survey_1[, c("item_1","item_2")]
Help
Where to get help
If you're a participant in one of the studies implemented in formr, please reach out to the person running the study.
If you're running a study yourself, there's several places to look for help.
- this documentation is a good start, just click on any of the tabs above.
-
There is a Wiki on Github. You can find a number of HowTos there and contribute yourself.
- start with learning to create a simple survey
- then learn to add feedback
- and if you're up for more, discover diary studies, peer rating studies, and find out how to send texts.
- You'll find answers to some frequently asked questions there too.
- You can ask (and answer!) questions in our Github Discussions forum for community support. Previously, we used a mailing list, but spam made it unusable. You can still browse it.
- If you find a bug, this is the place to describe it (preferably in a way that allows us to reproduce it, but we're also accepting Yeti reports).
- Please do not email the creators of formr for general support unless you've bought one of our consulting packages. Do reach out if you think sharing your concerns publicly could result in security concerns.